
During the spring of 2010, Radar Solutions International, Inc. was asked to locate a water supply for a town in the Adirondack Region of New York. Locating water supplies requires a variety of geophysical methods: Ground Penetrating Radar (GPR), Gravity, VLF, Seismic and Magnetometry. Using these five methods, RSI was able to provide our clients with an area that would yield the most water.
The area of investigation was underlain by dense to very dense sand gravel with cobles and boulders, which was situated on top of Pyroxene Hornblend Gneiss Bedrock. Previous studies suggested that unconsolidated deposits within the area could yield over 200 Gal./min. of groundwater.
Many personnel were involved to conduct this survey: from RSI President and Senior Geophysicist Doria Kutrubes, Senior Geophysical Consultant John (Jack) Kick, Geophysicist Melanie Denham and Geophysical Technician Katie Dowty. Also on site was Barton and Loguidice's Robin Verschneider who assisted us with the VLF method.
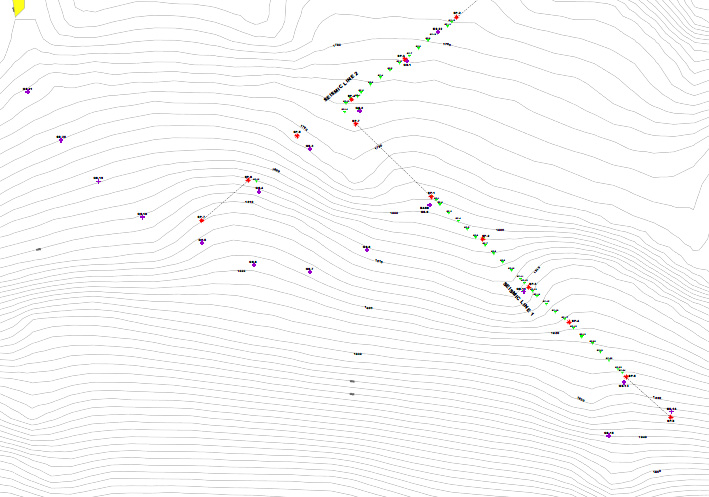
Area of investigation for the municipal water supply.
Using the GSSI SIR-3000 and a 40 MHZ antenna, we were able to achieve a maximum penetration of 135 ft. With the excellent penetration we were able to identify areas that would yield high volumes of water. Our GPR data was processed using GPR-Slice, which allows us to filter out false positives. The data shows large red reflectors in the upper 30 feet, which we were able to identify to be shallow boulders. From these depth slice images, we also observed the apparent trend of a potential fault or a zone of locked moisture, trending with a northwest dip.
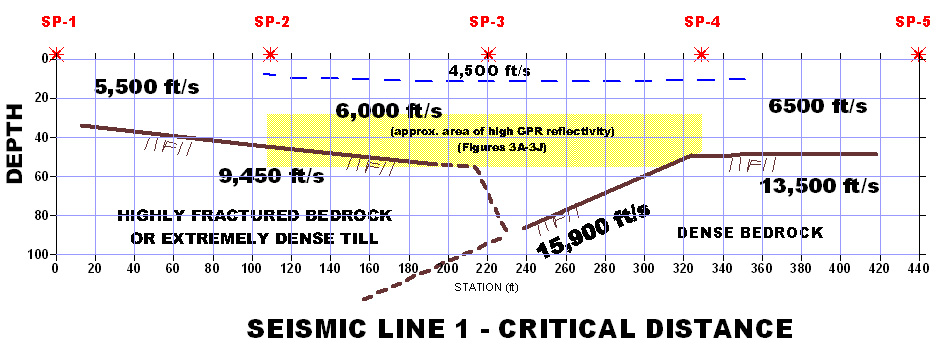
The gravity, seismic and tomography data were split into two survey lines denoted (SL-1 and SL-2). Along SL-1 the gravity profile shows a steep increase Bouger gravity values up gradient with values exceeding over 35 micro gals. This increase in micro gals correlates well with the bedrock features identified in the seismic and GPR data sets. Seismic data was assessed and compared against these two methods, SIPT2 and Critical Distance.
Observing a velocity ranging between 5,500 ft./s to 6,500 ft./s in the overburden and a 9,000 ft./s to 13,500 ft./s velocity in the bedrock, we detected a dipping feature towards the northwest. This dipping feature also correlated to high reflective features identified in the depth slice images, 35-55 feet below grade. This discontinuity may represent a fault zone between the two bedrock layers.
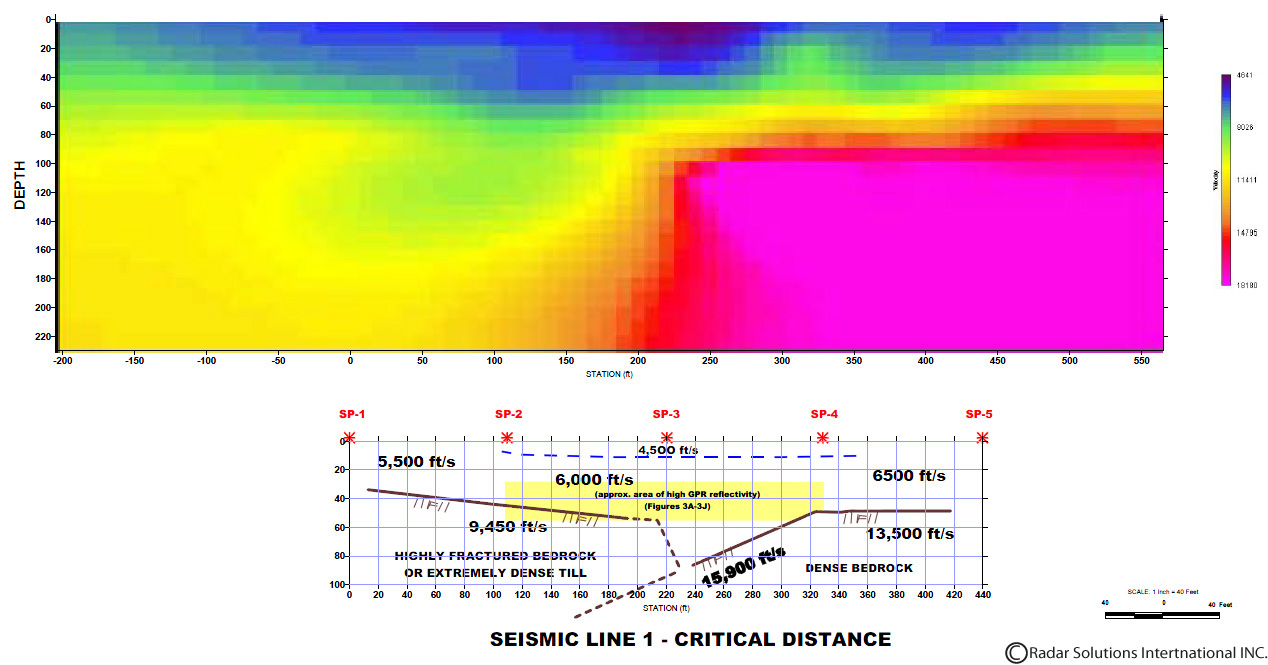
Tomography data for SL-1
The seismic and gravity results were then compared to our tomography generated using GeoTomo CT-11. The same travel time information was entered into the program using the same two layered model and velocities. As shown below, the tomography program generated tomogram with a misfit error of 1.A low misfit error (i.e. 1) is indicative that the tomogram matches very well with the observed field data. The same steep contrast between stations 200-220 observed in the seismic data is also observed in the tomogram. The VLF method further confirmed our speculation of water stored between stations 200 and 220, where we observed a sharp increase in conductivity.
This is the Bouger gravity anomalies vs. Seismic Data
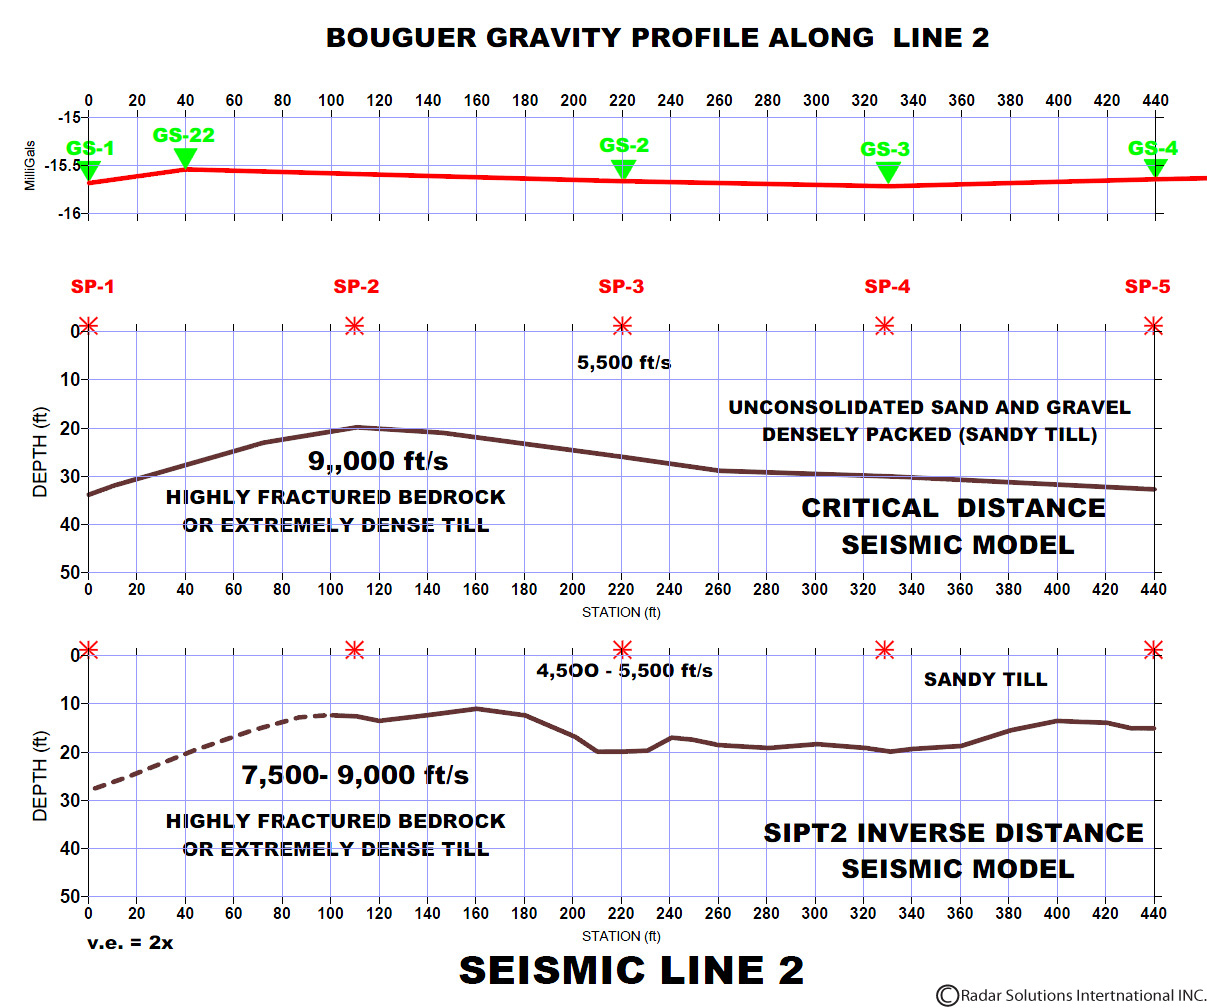
Survey line-2 (SL-2) was less complicated to interpret than SL-1. Using a basic two layer model, we determined the upper layer to consist of a 4,500 ft./s to 5,500 ft./s velocity and the deeper layer a 9,000 ft./s velocity, which were determined on the different densities of the two substrates and seismic data. Running the results through Critical Distance and SIPT2 ray tracing methods, we determined an undulated profile along SL-2. However, unlike SL-1, the SIPT2 model determined bedrock as shallow as 12 to 15 ft. below the surface, while the critical distance method determined bedrock about 20 ft. below the surface. Furthermore, our tomography model suggested a bedrock profile the same depth determined from the critical distance method. However, the tomography model used 8,300 ft./s to 9,400 ft./s for velocities of the deeper layer. In this instance our misfit error was less than 2, which makes our results reputable. The picture to the right: Gravity, Critical Distance and SIPT2 results of survey line 2.
It should be also noted that the tomogram also indicates that a 4,500 ft./s to 5,000 ft./s material is present to a depth of 40 to 50 feet. This decrease in velocity would suggest that this material may be water-bearing. Unfortunately we did not observe an extensive reflective area on the GPR depth slices. Our compiled Bouger anomaly values were plotted to show the spatial distribution and to verify the accuracy of our results. With stations over 2,000 ft. in length and a 153 ft. elevation change, our finding correspond to a general uniformity in subsurface with the exception of the very high anomaly observed on SL-1.
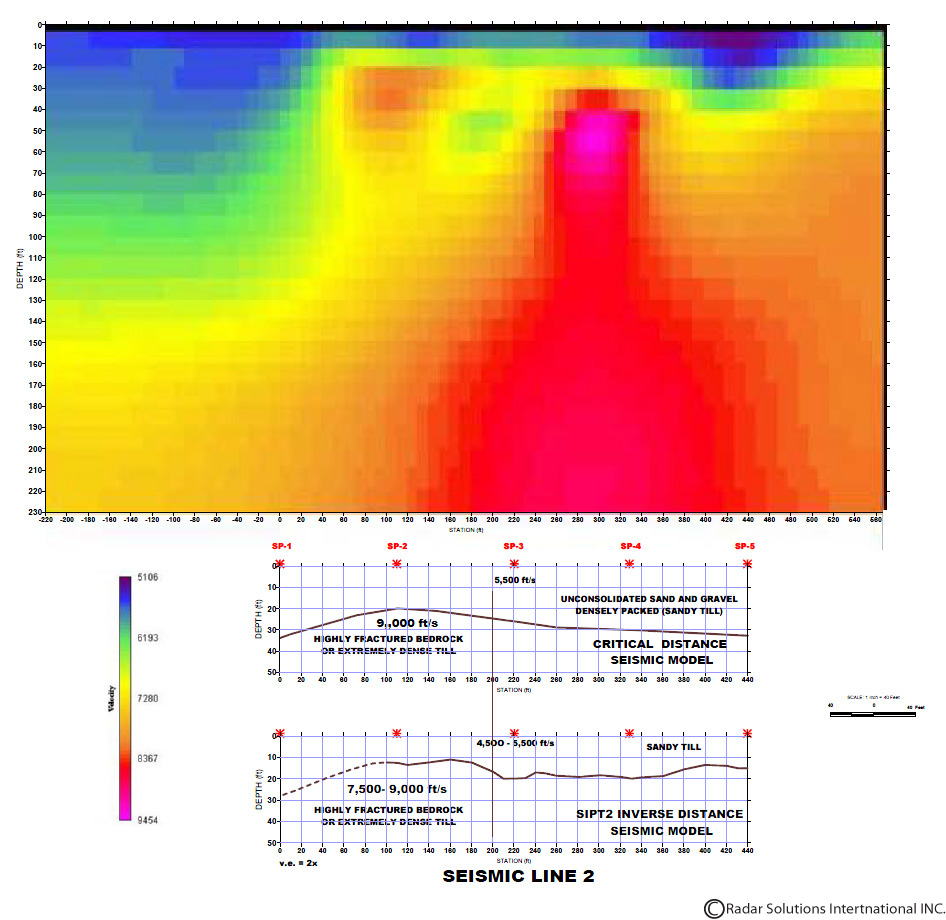
Tomogram of survey line 2 as compared to seismic data from Critical Distance and SIPT2 methods.
Acknowledgements: We would like to thank Barton and Loguidice for their assistance collecting data using the VLF.