
In late 2007 a slow release of gasoline was observed around a gasoline station in Southeastern Massachusetts. Monitoring wells were installed by Civil & Environmental Consultants, Inc. (CEC) to measure the movement and depth of this LNAPL plume. The monitoring wells recorded groundwater at 45 and 50 feet below the ground surface (bgs) in the unsaturated unconfined sand a gravel units. The migration of the LNAPL plume was very unpredictable, and did not follow typical pathways for a LNAPL plume within the saturated zone. Due to the unusual characteristics of the site, ground penetrating radar (GPR) and EM-61 were used to determine the preferential pathway of the LNAPL plume. Using these two methods we were able to locate utilities that might alter the migration of the LNAPL plume, or any UST's that may act as a source for any contaminates.
In the Summer of 2013, RSI's President and Senior Geophysicist Doria Kutrubes, Geophysicist Amy Ziter and CEC's Glen Cote began investigating the migration of the LNAPL plume. To determine the pathway of this contamination, RSI used GSSI's SIR-3000 coupled with a 400 MHZ, 200 MHZ and 60 MHZ antennas. In this instance the penetration of the 400 MHz antenna was to shallow to reach the depth of the LNAPL plume, however, this antenna does an excellent job at detecting shallower features like utilities and UST's. From the 200 MHz depth slice images we observed the plume migrating from the southwest corner of the building, past MW-09-2 in the south. The animation provides a good visual of the LNAPL migration from the southwest corner of the building.
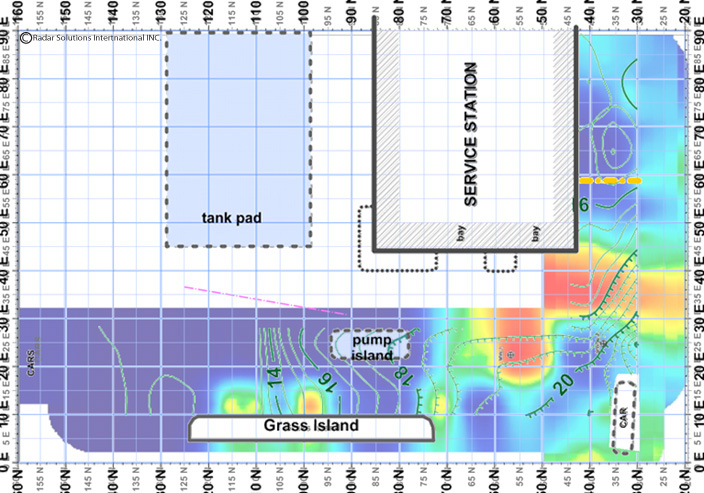
Using the fundamentals of hydrogeology, the migration of the LNAPL plume should move vertically through the vadose zone with little movement horizontally. However, the 200 MHz GPR data identified layering that could influence the horizontal movement of the LNAPL plume. Additionally, the 400 MHz data identified a buried tank pad located from the building to the grass island to the west, as well as two utilities paralleling the road. EM-61 data also identified the same tank pad and utilities, which reaffirms the accuracy of our radar data. The image to the left is of the 200 Mhz data.
The 400 MHz data below shows three major zones of reflectivity. One zone is from the west edge of the pump island to the east edge of the grass island. The next large reflector persist throughout the entire depth slice images and extends from the grass island to the southeast edge of the building. The depth slice images also identified another high reflective area from the 8.2 to 8.7 ft. bgs, which extends along the southern portion of the building. The high reflective areas appear to follow observed depth gradients, however further investigation is needed to determine if these reflective areas are the preferential pathway of the LNAPL plume.
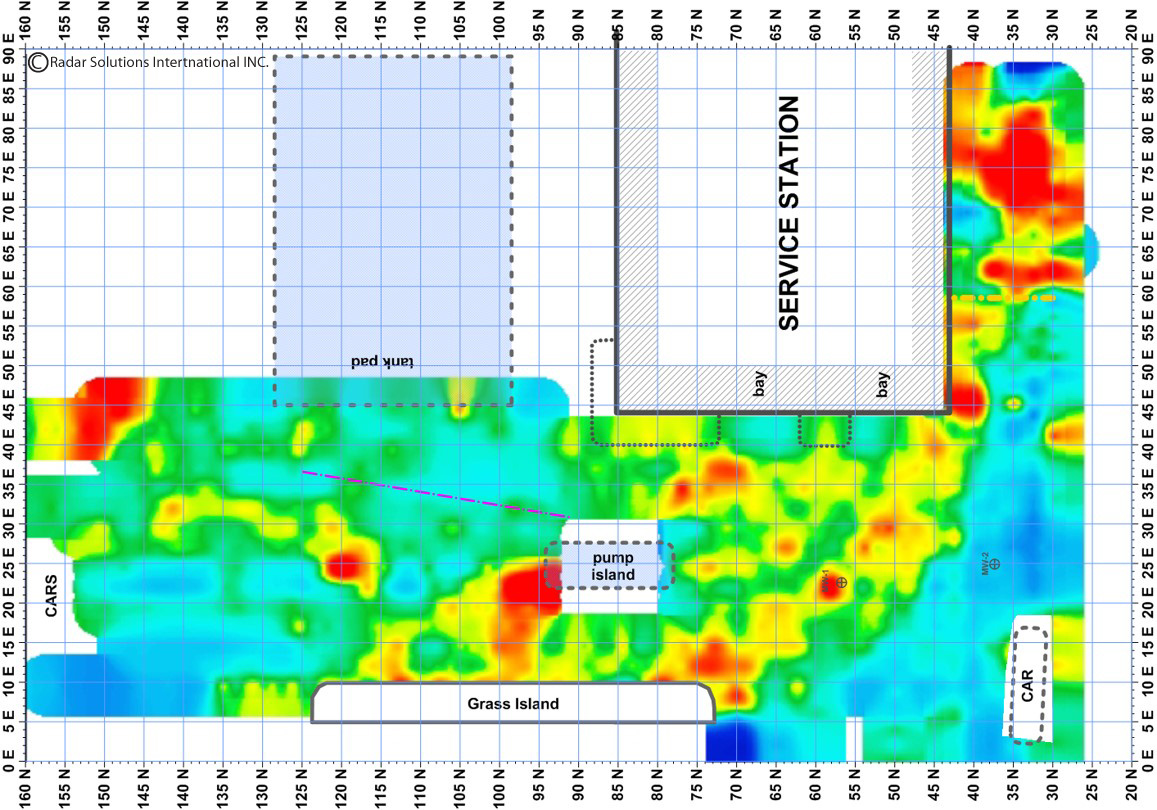
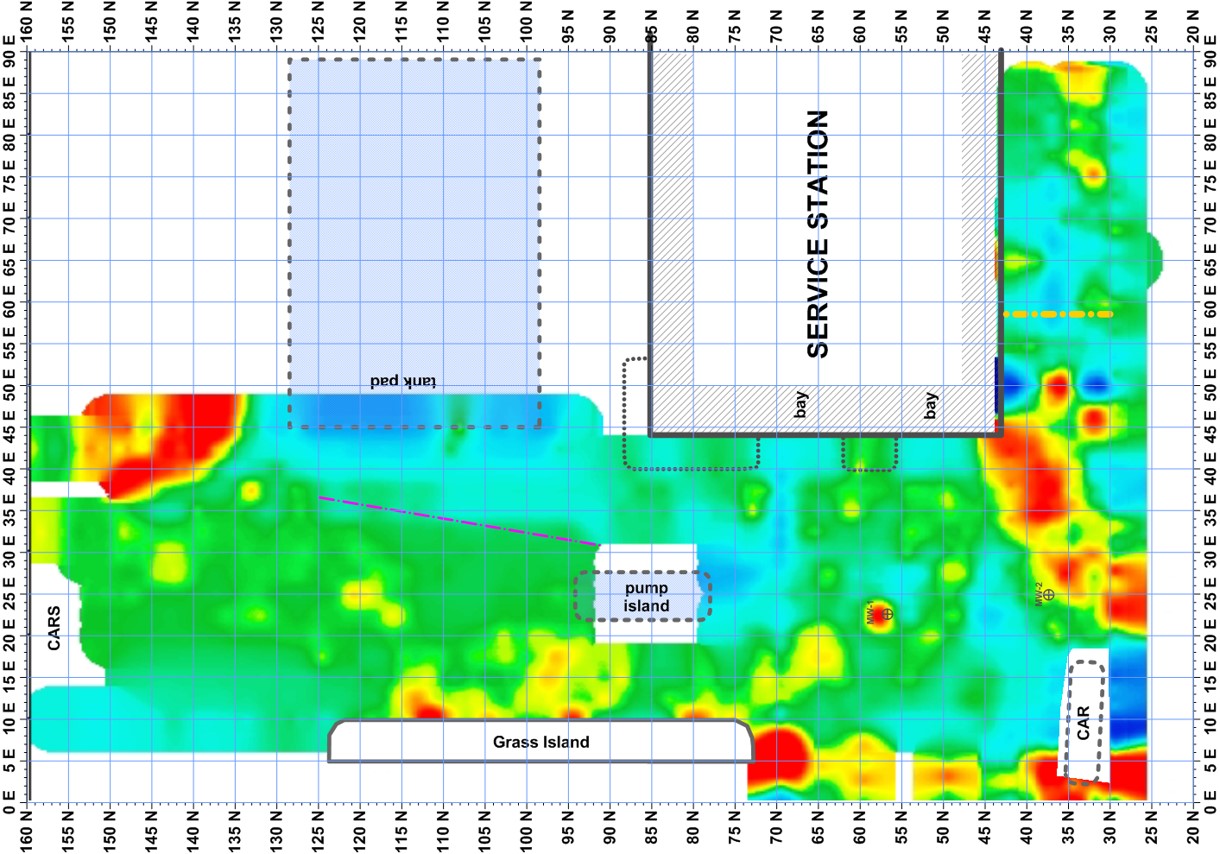
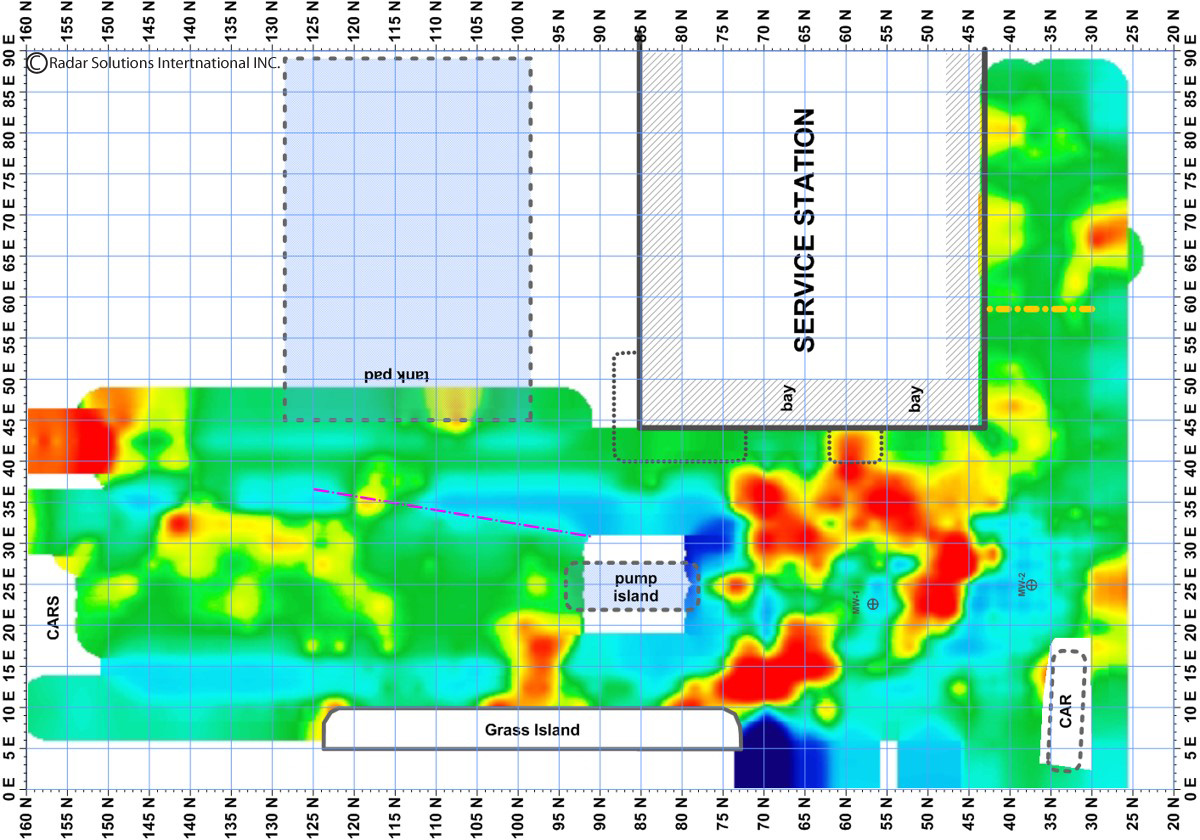
The images above show the three reflective zones from the 400 MHz antenna generated using GPR-Slice.
Acknowledgements: We would like thank CEC for their help on and off site, which enabled us to deliver our best results.